![LogoComparion[1]](https://www.expertchoice.com/hubfs/Logos/LogoComparion%5B1%5D.svg)
Part 3: Meaningful Improvements in Formulation and Prioritization of Strategic Themes and Key Results Indicators
In the first blog post in this series, I wrote about the areas within Lean Portfolio Management that involve measurement and decision-making and how the recommended LPM activities that are intended to minimize waste may instead increase waste by relying on inaccurate measurements and decsion-making shortcuts.
In the second blog post in this series, I wrote about three LPM activities – formulating strategic themes, value stream budgeting, and prioritization of features in a backlog – and where there is room for improvement.
In this blog post, I’ll detail how you can realize more value when formulating strategic themes and key results indicators and measuring progress on KRIs.
1) Brainstorm for strategic themes. Collaborative brainstorming invites a multitude of perspectives, capitalizing on each participant’s unique experiences and knowledge. This helps lead to a broader range of ideas, fosters innovation, and helps avoid tunnel vision.
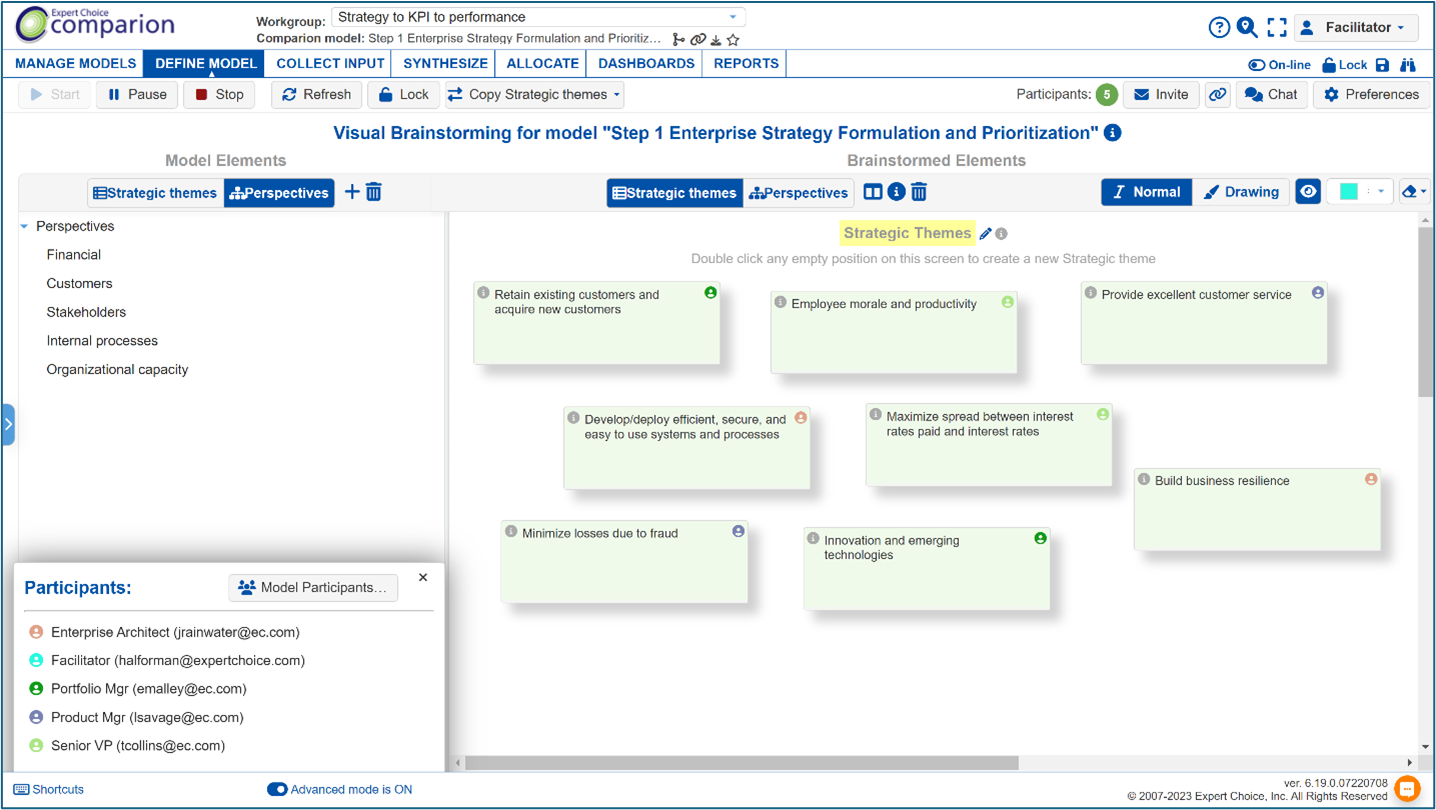 Figure 1 - TeamTime Brainstorming for strategic themes
2) Prioritize potential strategic themes by collaboratively scoring their anticipated contribution to organization perspectives.
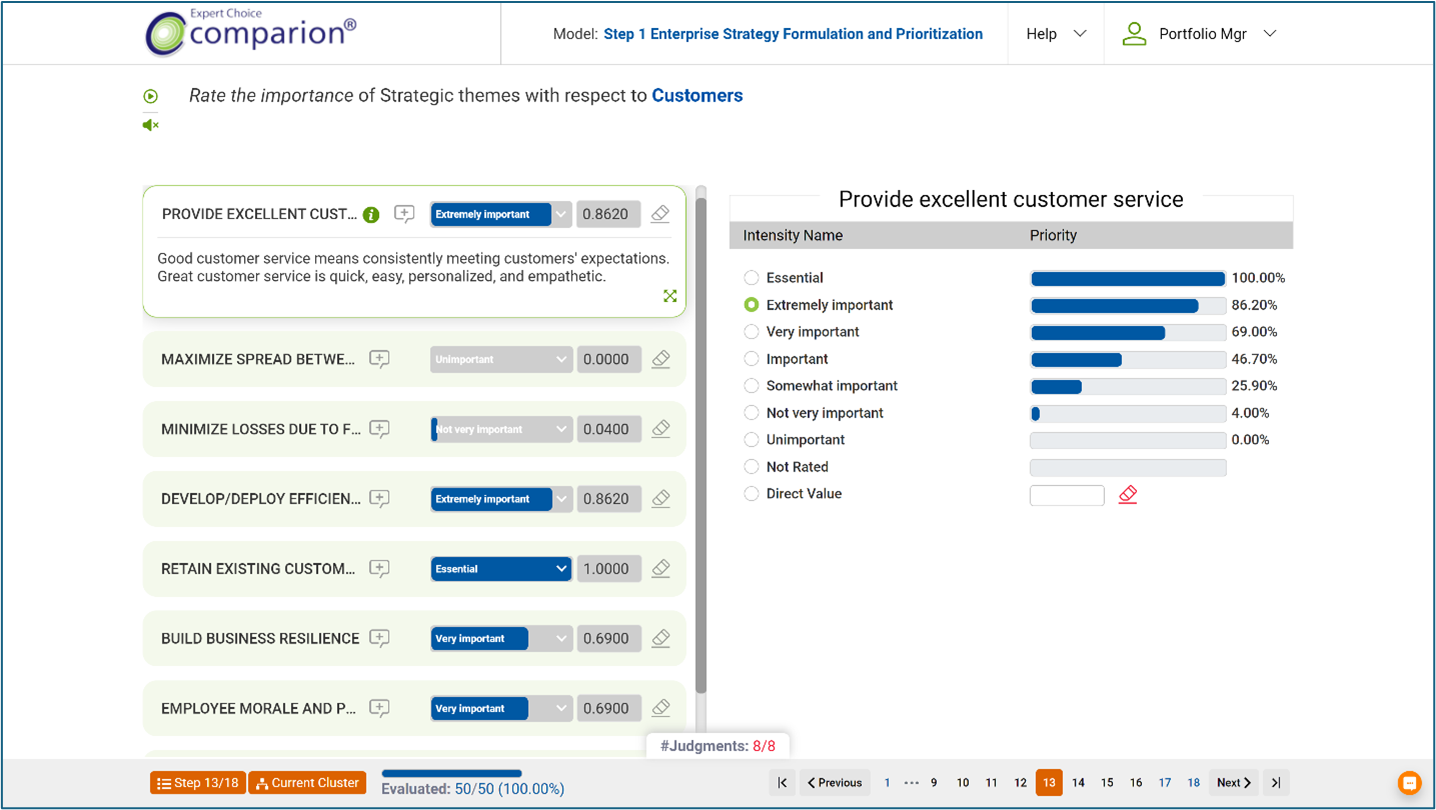 Figure 2 - Anytime evaluation of the contribution of strategic themes to portfolio perspectives
3) Analyze, socialize, and iterate on the resulting strategic theme priorities.
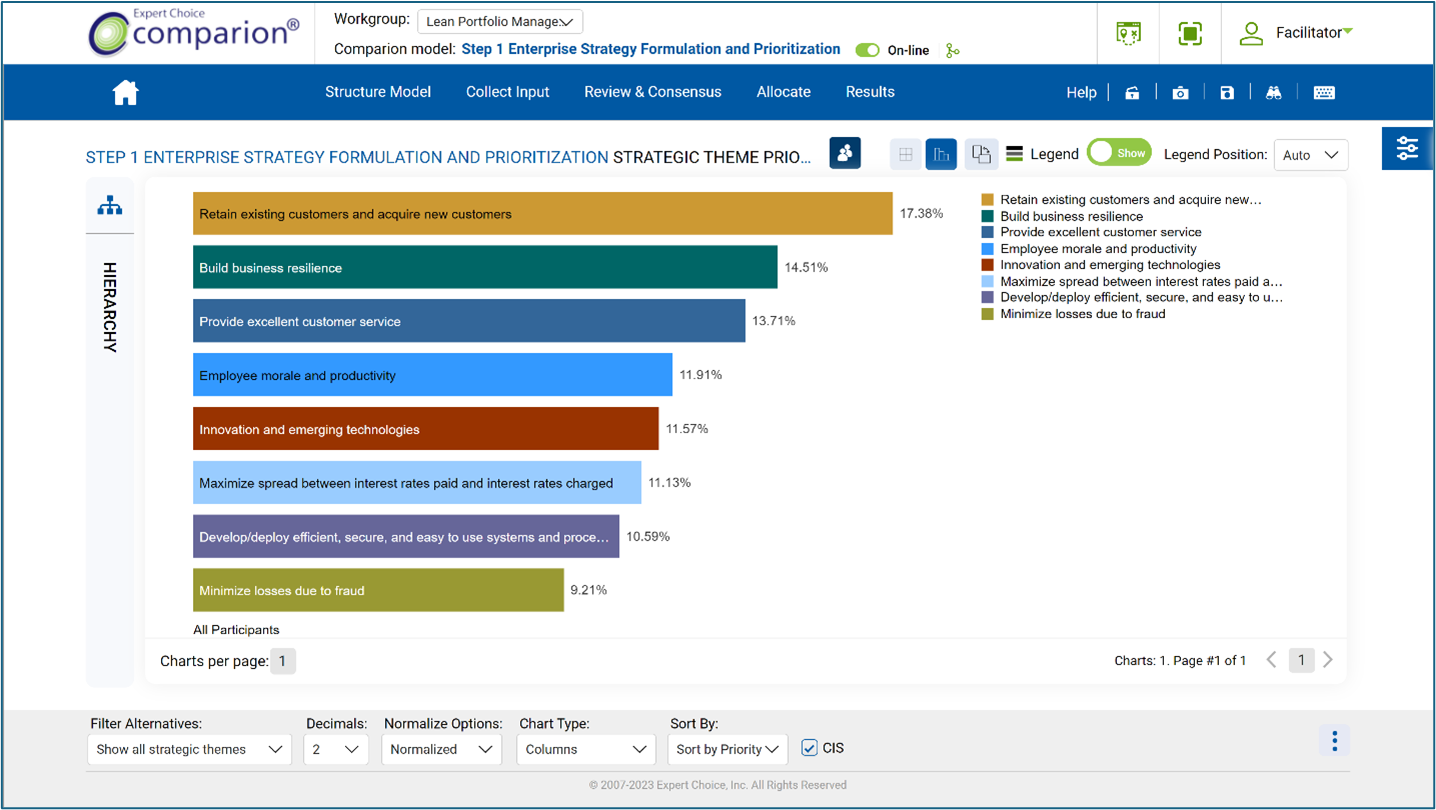 Figure 3 - Priorities of strategic themes based on relative importance of perspectives and expected contribution of strategic themes
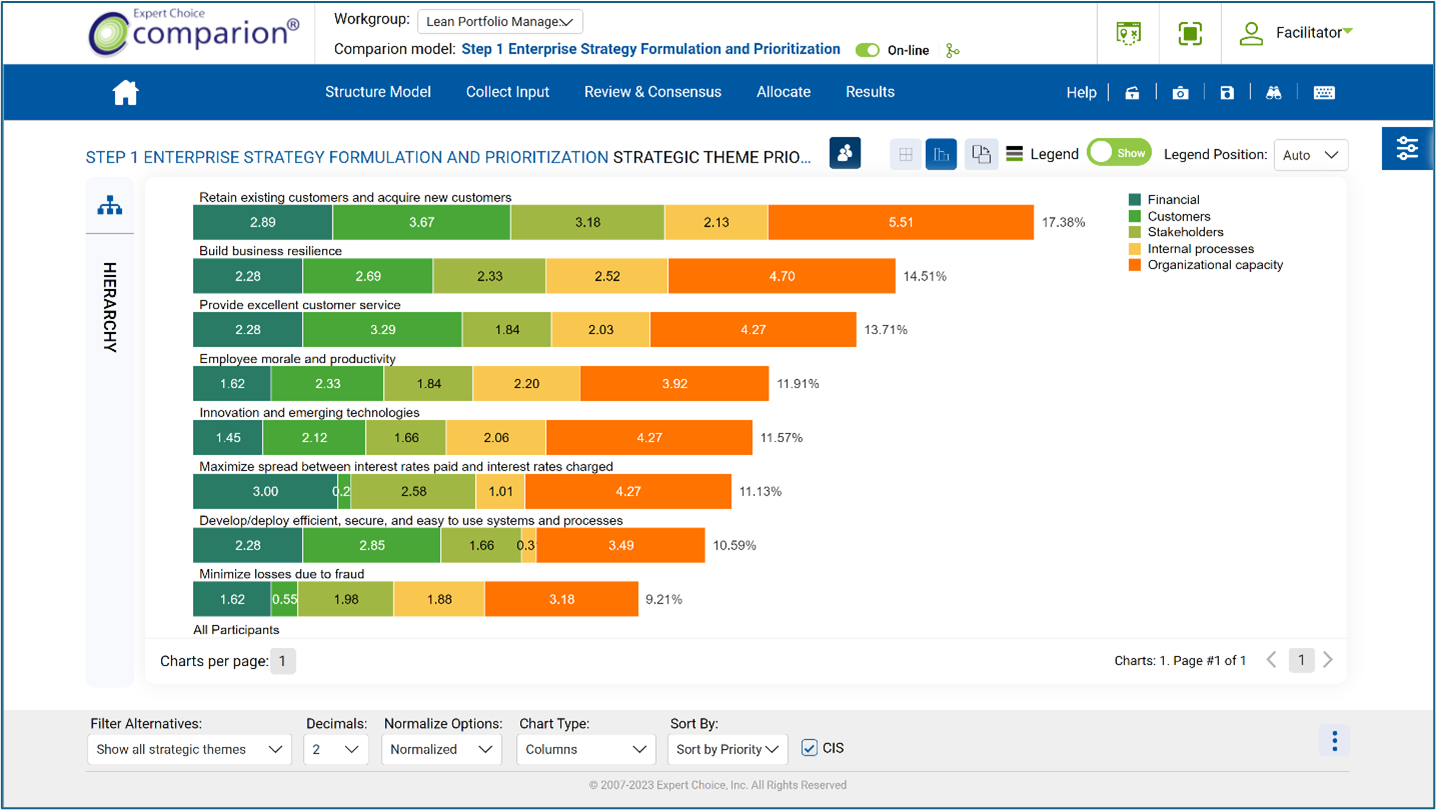 Figure 4 - Priorities of strategic themes and contributions to portfolio perspectives
4) Brainstorm for the Key Results Indicators (KRIs) that will provide an accurate picture of progress towards realization of strategy.
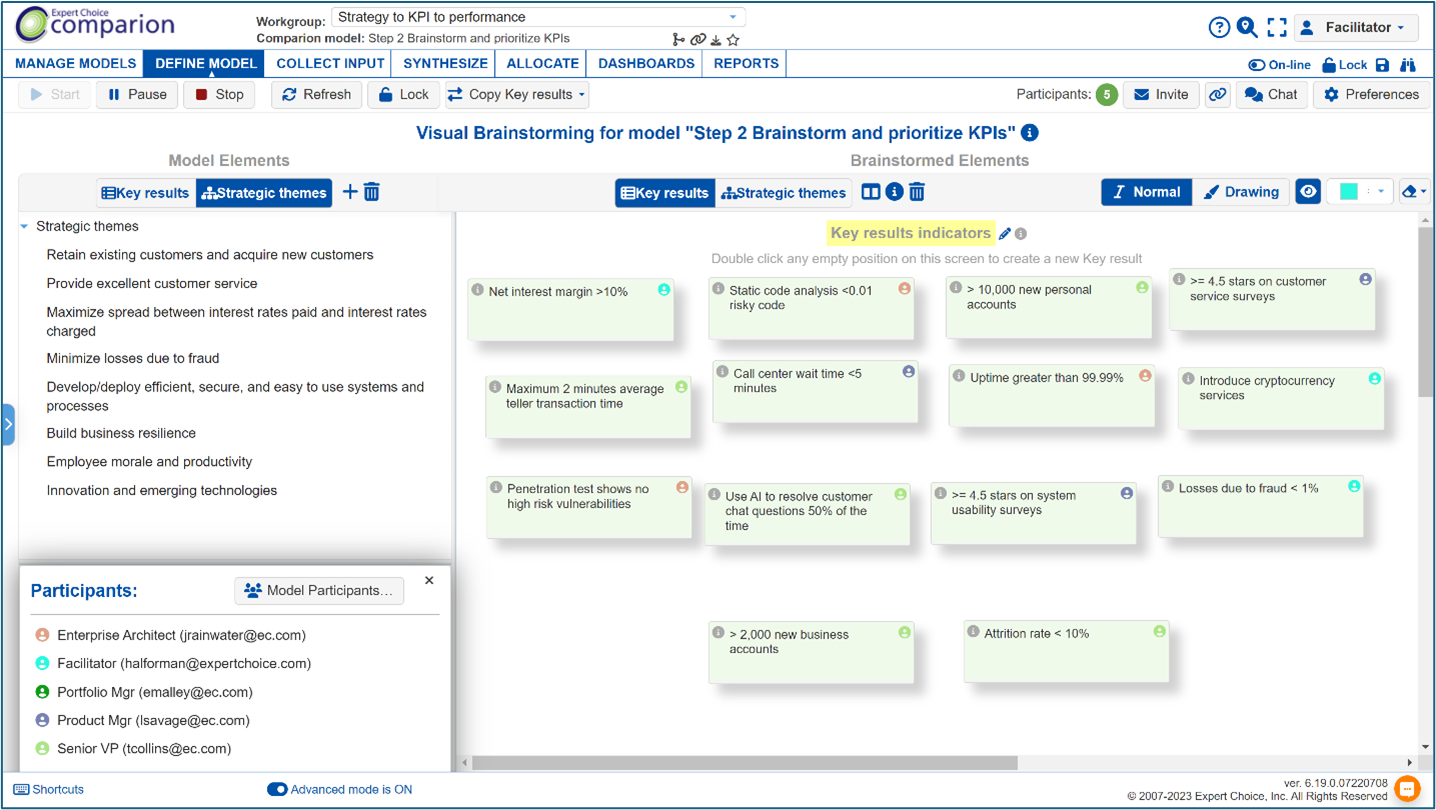 Figure 5 - Teamtime brainstorming for key results indicators for measuring progress on strategic themes
5) Specify/confirm the expected contributions of KRIs to strategic themes.
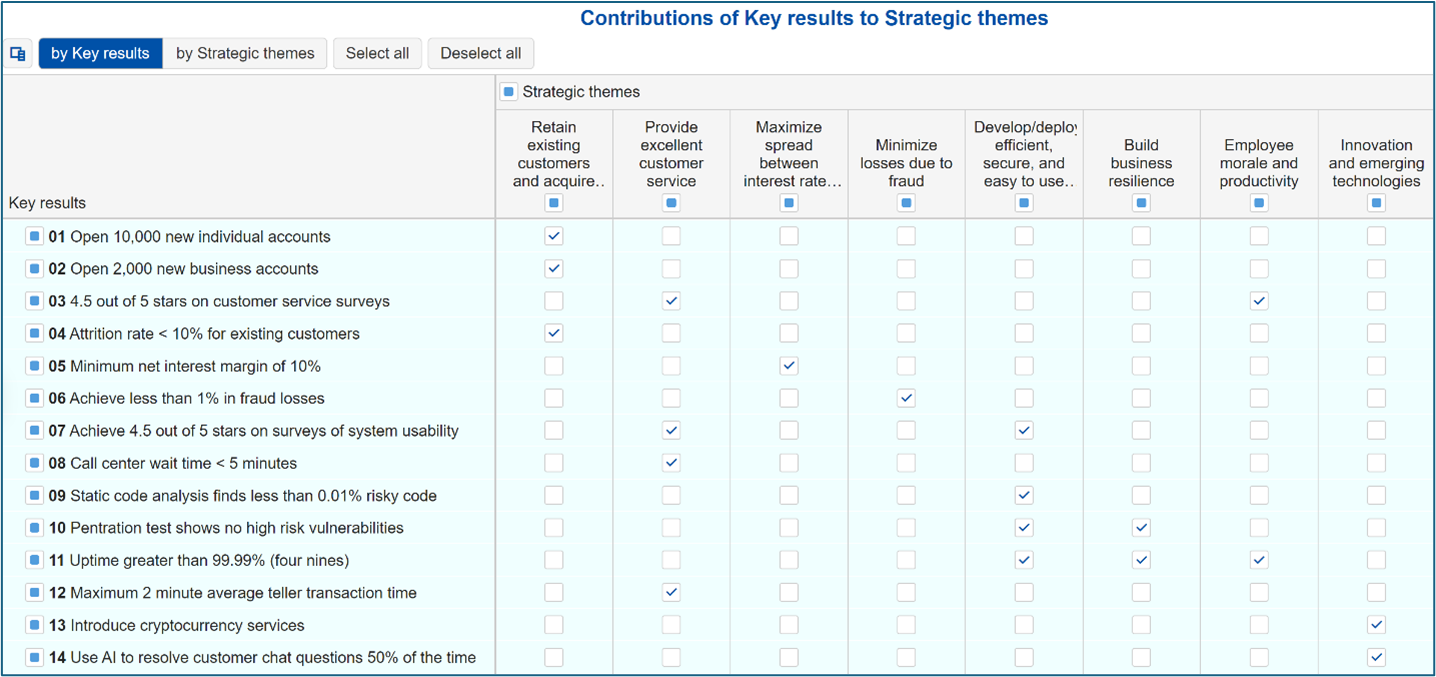 Figure 6 - Contributions of key results indicators to strategic themes
6) Prioritize key results indicators. Don’t assume that all KRIs are equally important. Don’t simply assign priorities; derive them with pairwise comparisons.
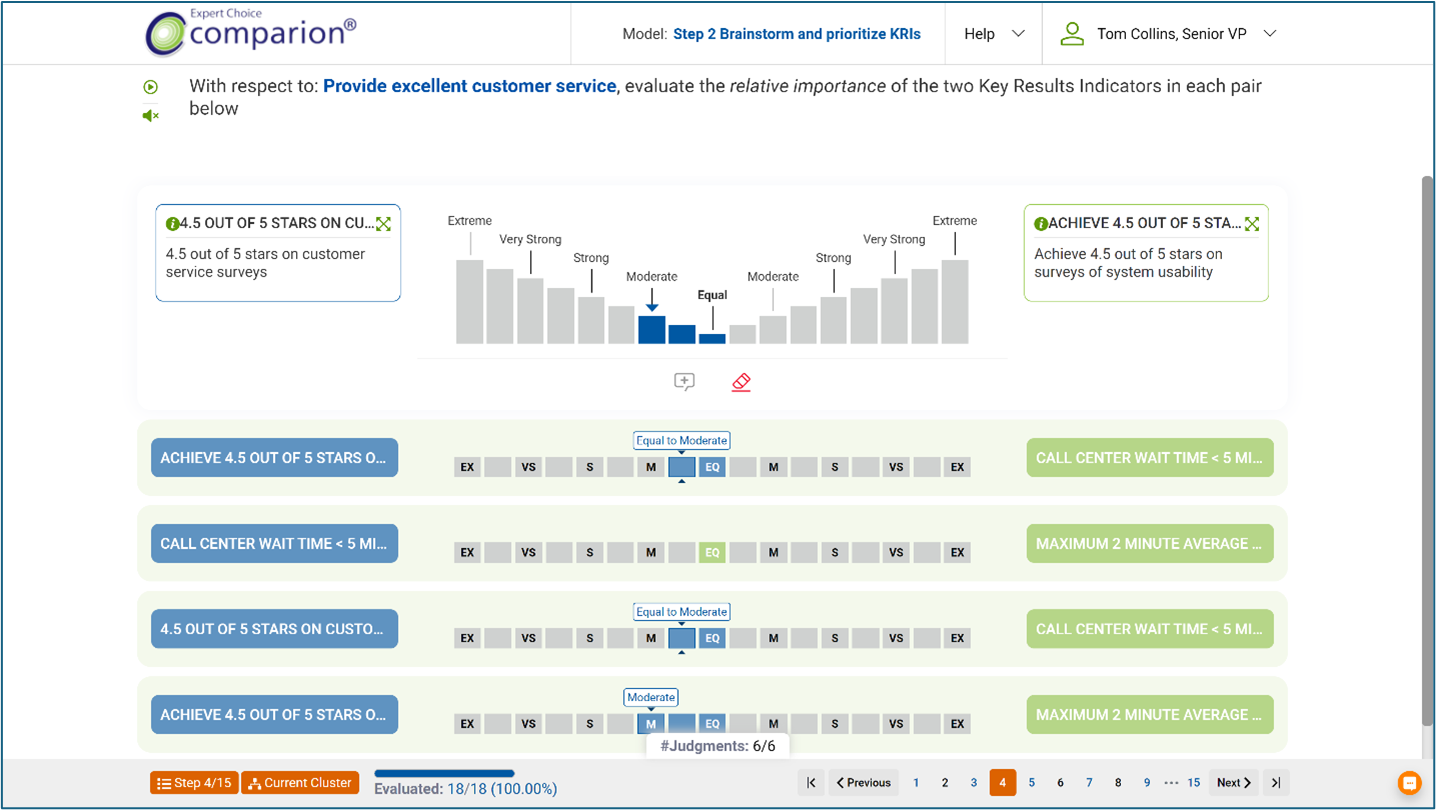 Figure 7 - Pairwise comparisons for deriving ratio scale priorities of key results indicators
7) Analyze, socialize, and iterate on the resulting KRI priorities.
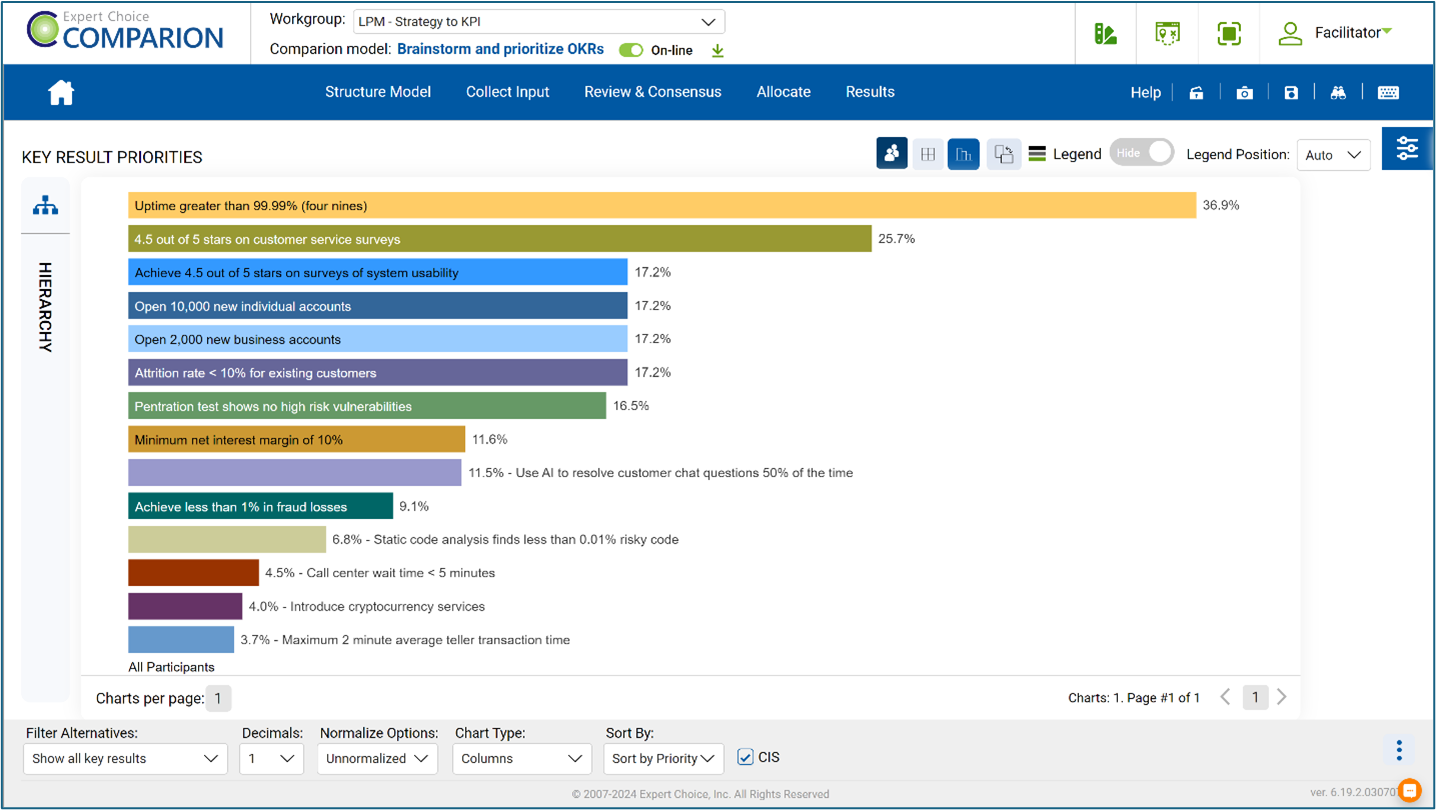 Figure 8 - Prioritized key results indicators
8) Normalize KRI data to avoid comparing apples to oranges.
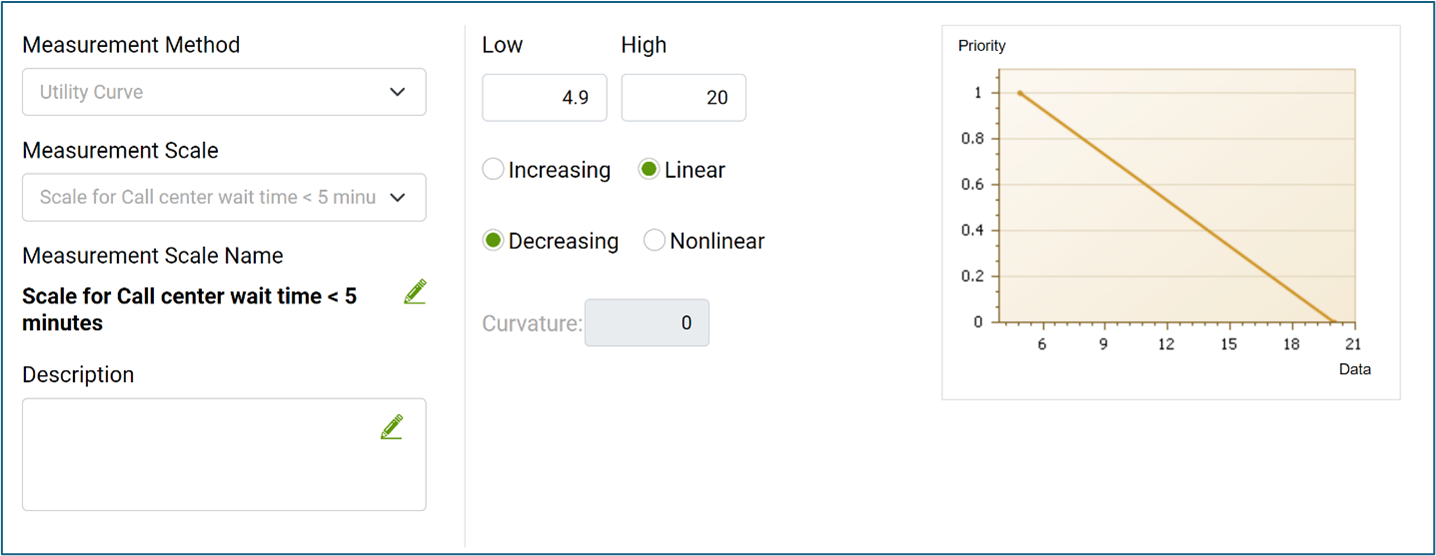 Figure 9 - Rating scale for normalizing call center wait time KRI data
9) Collect KRI data at the desired time intervals.
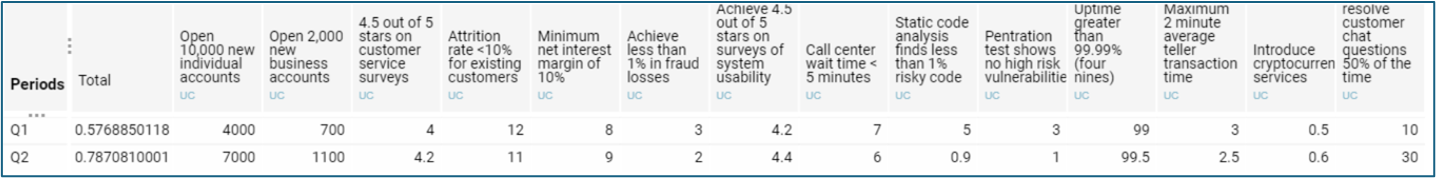 Figure 10 - Unnormalized KRI data for Q1 and Q2
10) Track progress on KRIs. By weighing KRIs according to their importance, we get a much better picture of progress towards our goals.
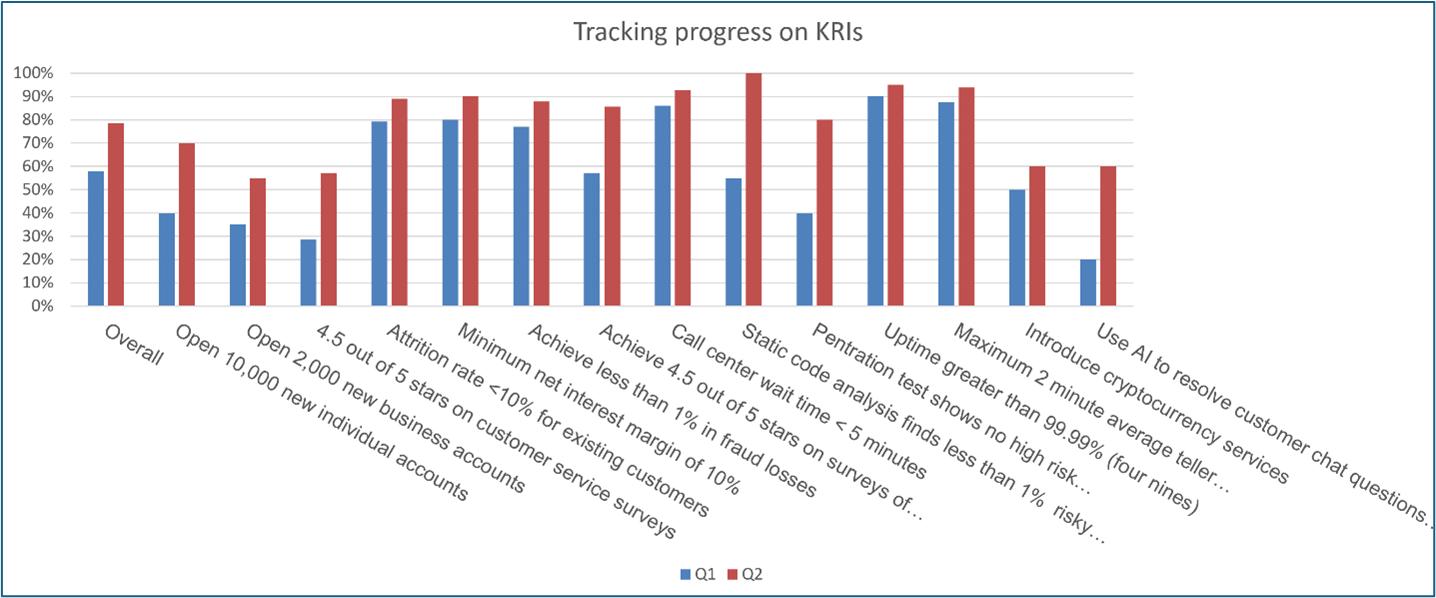 Figure 11 - Chart of normalized KRI progress for Q1 and Q2
In the next blog post, I’ll discuss the specific opportunities for improving value stream budgeting.
Please leave a comment below.